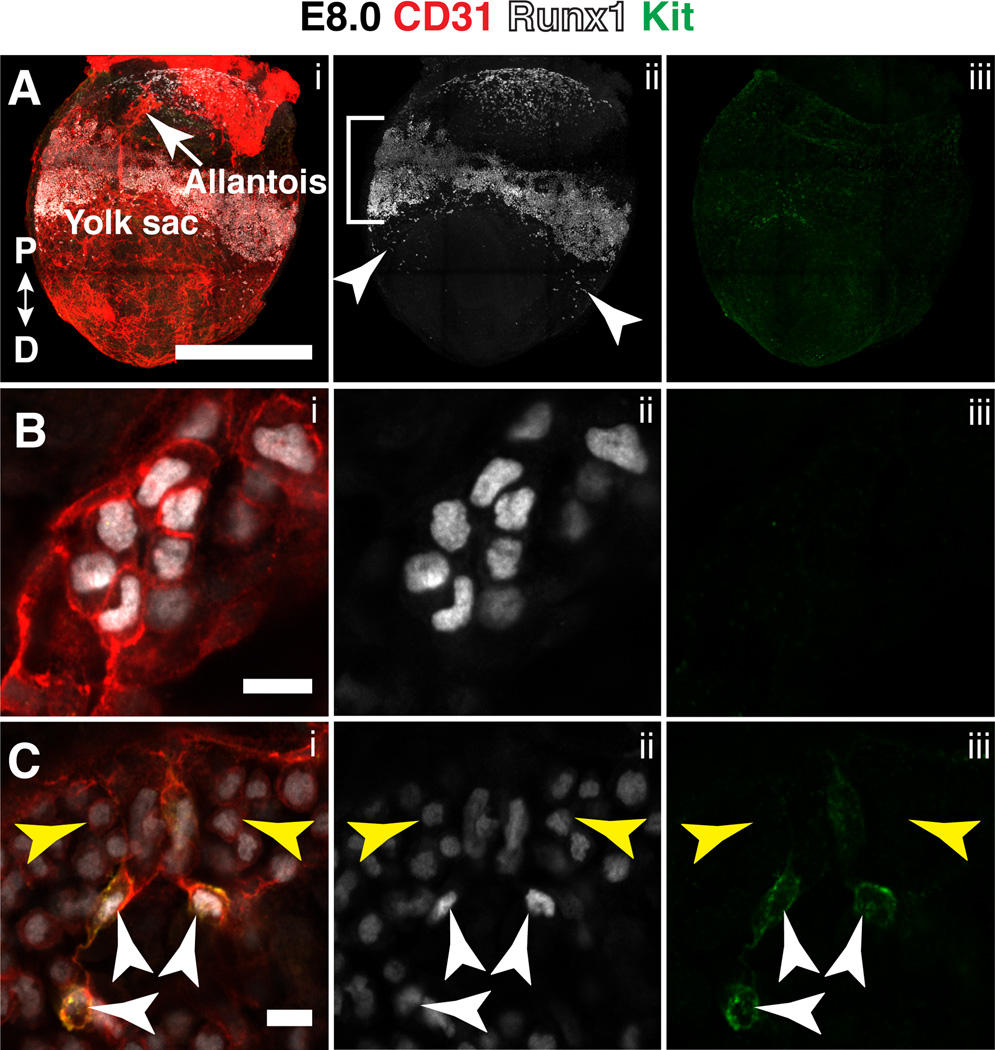
Figure 1. Runx1 and Kit expression in the yolk sac at late head fold stage.
(A–C) A late head fold stage (E8.0) mouse embryo immunostained for CD31 (i), Runx1 (i,ii) and Kit (i,iii). (A) Confocal Z-projection. Proximal (P) and distal (D) axes are indicated in i. Bracket in ii indicates band of Runx1+ cells in the proximal yolk sac. Arrowheads in ii point to Runx1+ cells located distal of the proximal band of Runx1+ cells. Scale bar = 500µm (see Movie 1 for animation of Z-stack). (B) Magnified image of Runx1+ cells in the distal yolk sac. Scale bar = 10µm. (C) Single optical projection showing hematopoietic cells (yellow arrowheads) and hemogenic endothelial cells (white arrowheads) in the proximal band of Runx1+ cells in the yolk sac. Scale bar = 10µm.

