
Figure 5. Increased IL-4 and IL-13 levels in HuR-overexpressing mouse splenocytes.
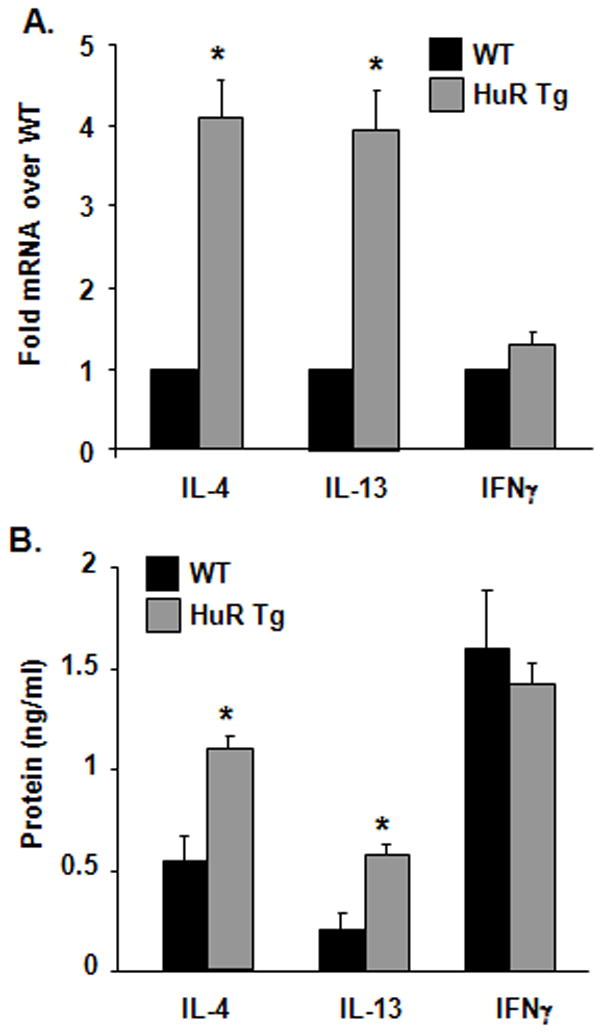
(A) Cytokine mRNA measured by real-time PCR and (B) protein levels assessed by ELISA from splenocytes derived from FVB-HA HuR transgenic mouse and WT control activated with PMA and ionomycin. Mean ± SEM of n = 3. (*p < 0.005 compared to WT)