Figure 2.

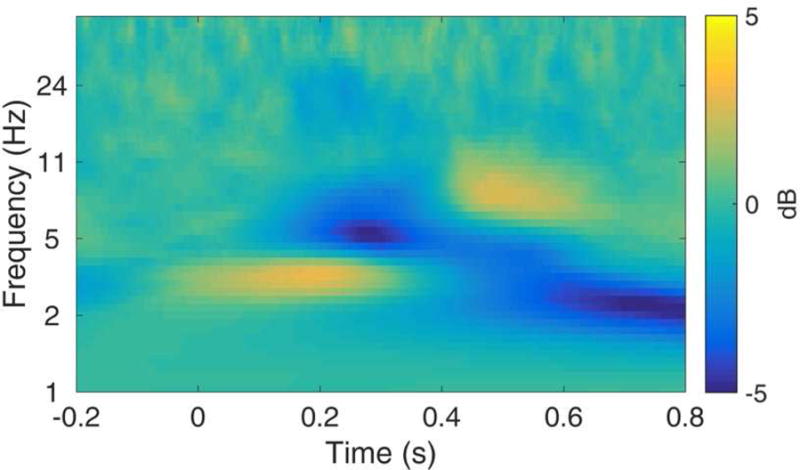
Time-frequency plot for the gain minus loss difference at FCz, with more yellow indicating greater activity to gain relative to loss and more blue indicating greater activity to loss relative to gain.

Time-frequency plot for the gain minus loss difference at FCz, with more yellow indicating greater activity to gain relative to loss and more blue indicating greater activity to loss relative to gain.