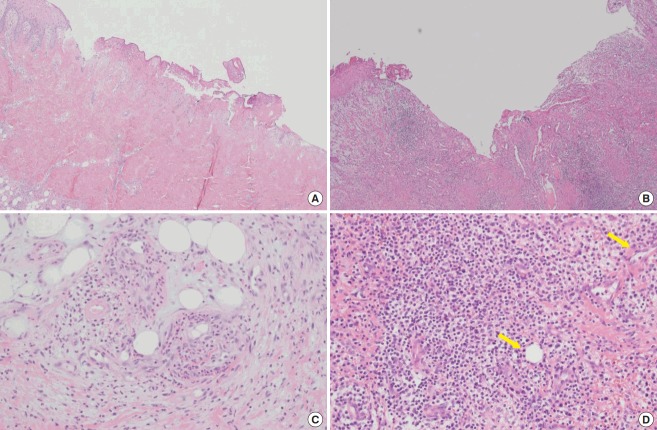
Fig. 6. Histologic evaluation of the control group.
(A) Pre-treatment (H&E, ×40); necrosis with neutrophil pigmentation. (B) Post-treatment (H&E, ×40); persistent acute and chronic inflammation. (C) Pretreatment (H&E, ×200); inflammation with necrosis. (D) Post-treatment (H&E, ×200); vascular marking (yellow arrows) with granulation tissue formation.

