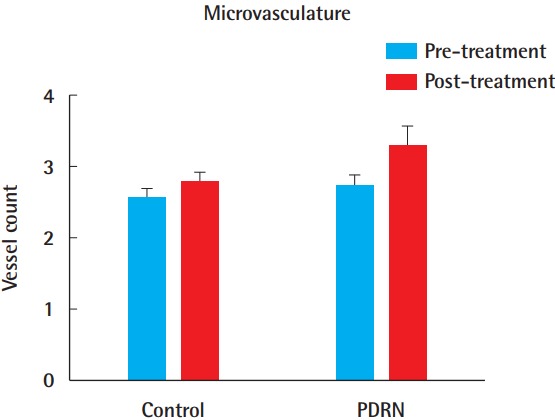
Fig. 8. Vessel density.

No statistically significant difference was found between the control group and the PDRN group in vessel density (average number of vessels per visual field) (P=0.094). All data are expressed as mean±standard deviation. PDRN, polydeoxyribonucleotide.
