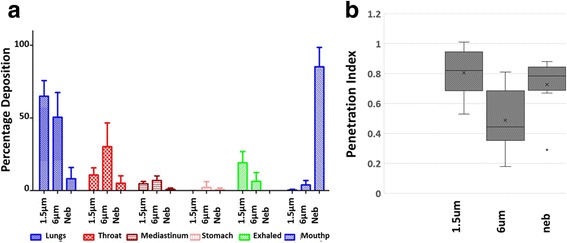
Fig. 3.

Lung Deposition and penetration Index. (a) percentage of total dose deposited in the lungs (blue), throat (red hashed), mediastinum (red striped), stomach (pink), exhaled (green) and left in the mouthpiece (blue hashed) for each delivery method (STAG 1.5 μm and 6 μm and nebuliser). (b) Box and whisker plot of lung penetration index. Lung penetration index is illustrated for subjects inhaling the 1.5 μm particle size, the 6 μm particle size and the nebulised salbutamol. Mean (x), median (-), interquartile range (boxes) and outliers (grey spot: subject TOP0008) are shown
