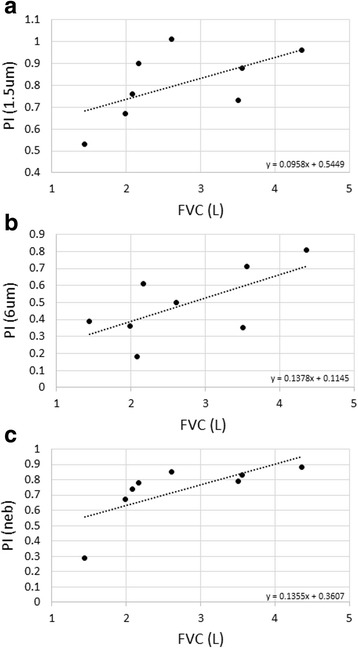
Fig. 4.

Relationship between pulmonary function and penetration index. Scatter plots of the relationship between FVC (L) and penetration index (PI) for: (a) 1.5 μm particle size (STAG), rho = 0.66667 p = 0.07099; (b) 6 μm particle size (STAG) rho = 0.59524 p = 0.11953; (c) nebulised rho = 0.92857 p = 0.00086. Linear regression analysis (line) is illustrated with its equation. FVC L: forced vital capacity in litres; rho: Spearman Rank Correlation Coefficient
