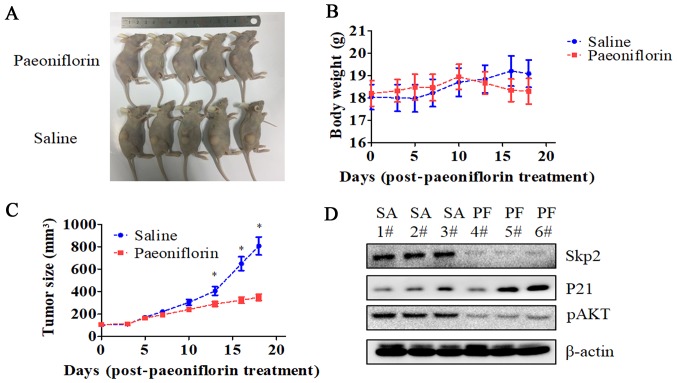
Figure 7.
Antitumor effects of PF in a xenograft model. (A) Images of U87 cell-derived tumors from nude mice treated with PF or saline (n=5/group). (B) Body weight of mice monitored three times per week starting from the time of PF treatment. (C) Tumor size was measured with caliper three times per week starting from the time of PF treatment. (n=5/group). (D) Skp2, P21, and p-AKT expression in the tumors, as determined by western blotting. *P<0.05 vs. saline group.

