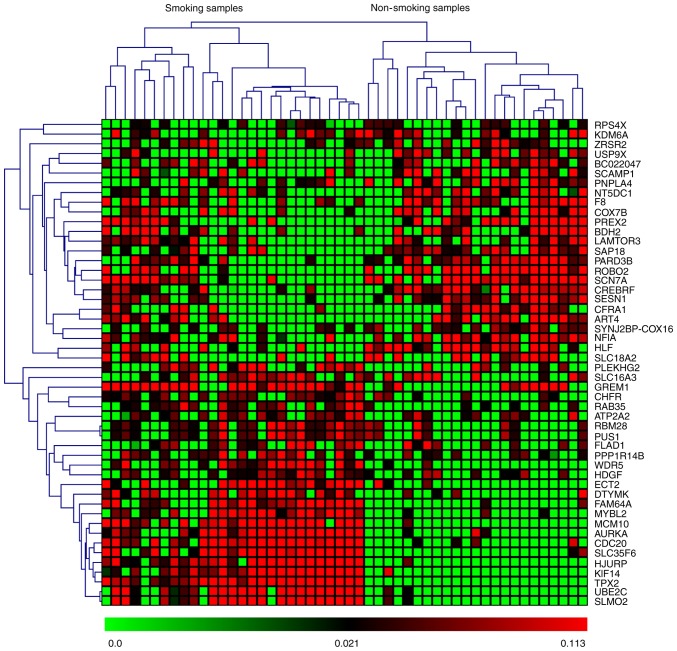
Figure 5.
Heat-map representation of the expression profiles for the top 25 upregulated and downregulated differentially expressed genes (DEGs) in the GSE40791 dataset. The clustering of the selected genes on the heat-map was performed using a hierarchical clustering algorithm that uses an average linkage method and Pearson's correlation coefficient.

