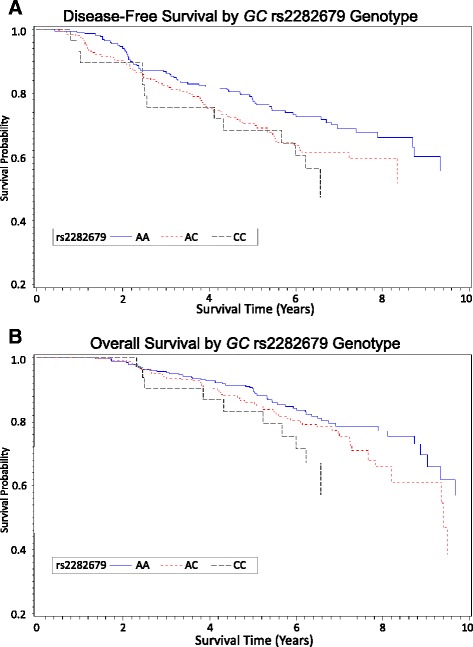
Fig. 1.

Survival curves for (a) disease-free survival and (b) overall survival by GC rs2282679 genotypes. Adjusted for sex, age at diagnosis, tumor stage at diagnosis, marital status, race, reported chemoradiotherapy, MSI status, BRAF mutation status, tumor location, fruit intake, and body mass index
