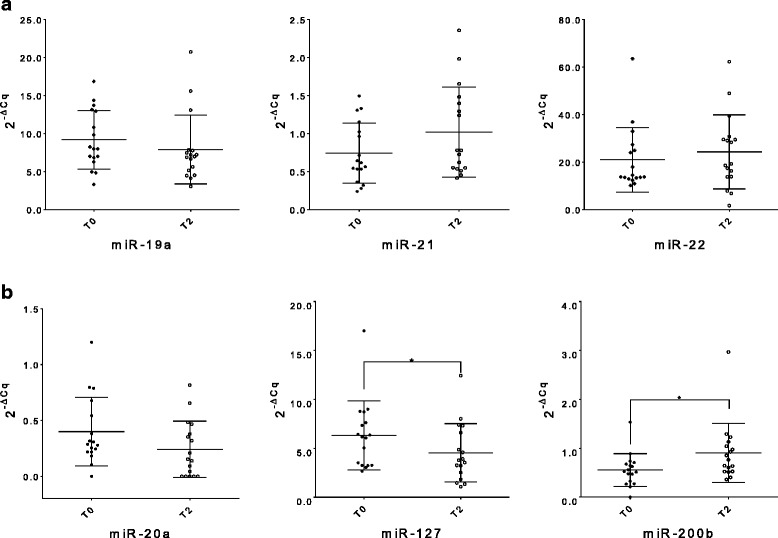
Fig. 3.

Whole blood miRNA levels inter-differentiating the same patient group between T0 and T2. The dot plots show relative levels of the different oncogenic miR-19a, − 21 and − 22 (a) and tumor suppressors miR-20a, − 127 and -200b (b). The differences were calculated using the Wilcoxon test; only the corresponding significant p-values are indicated in the graphs (*p ≤ 0.05). (T0: before adjuvant therapy; T1: after adjuvant therapy)
