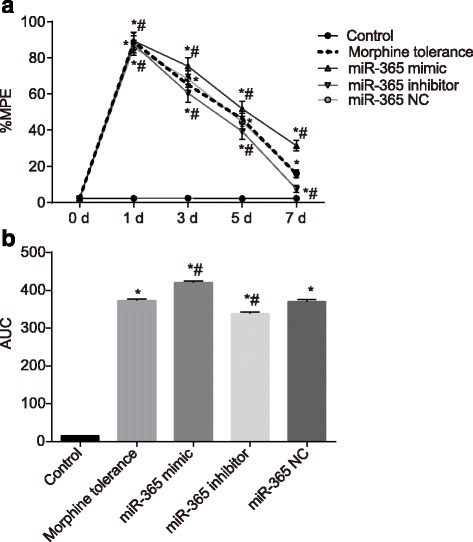
Fig. 1.

The %MPE of rats in each group after administration at 0 d, 1 d, 3 d, 5 d and 7 d. Note: A, line graph of %MPE in each group; B, AUC analyses of %MPE in each group; %MPE, percentage of the maximal possible analgesic effect; N = 8; *, P < 0.05 compared with the control group; #, P < 0.05 compared with the morphine tolerance group; AUC, area under the curve; NC, negative control
