
Fig. 5.
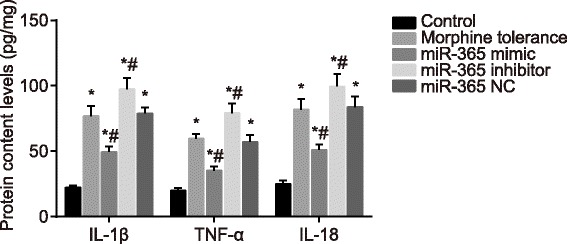
Contents of IL-1β, TNF-α and IL-18 of rats in spinal cord tissues in each group after administration at day 7. Note: N = 8; *, P < 0.05 compared with the control group; #, P < 0.05 compared with the morphine tolerance group; IL-1β, interleukin 1 beta; TNF-α, tumor necrosis factor alpha; IL-18, interleukin 18; NC, negative control