Fig. 3.

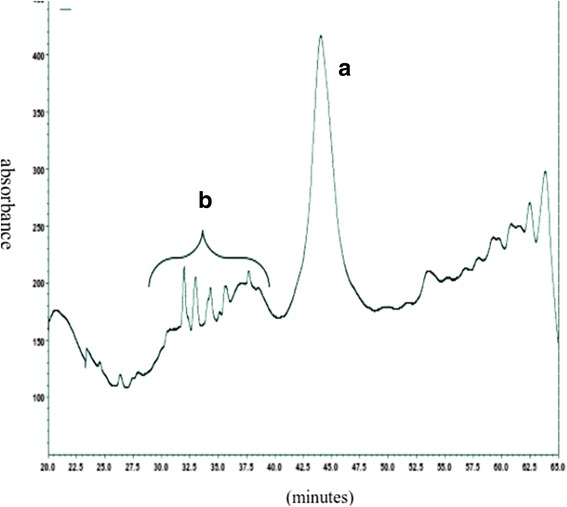
HPLC diagram of n-butanol extracted samples. The (a) peak in the 44 min of isolation belongs to GPI according to GC-MS and HPTLC analysis. The (b) peaks of the other glycolipipids of schizont stage of T. annulata

HPLC diagram of n-butanol extracted samples. The (a) peak in the 44 min of isolation belongs to GPI according to GC-MS and HPTLC analysis. The (b) peaks of the other glycolipipids of schizont stage of T. annulata