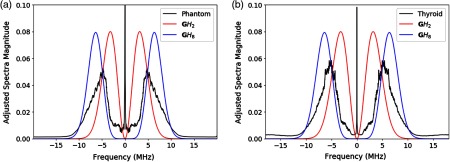
Fig. 1.
(a) Ensemble averaged spectra of the test phantoms (27 frames) compared with spectra of the GWH functions and . (b) Averaged spectra of the thyroid nodules (46 images) compared with spectra of the GWH functions and . For each frame, individual A-line spectra were computed and averaged across the frame. The final spectra shown are subsequent averages of all frames.

