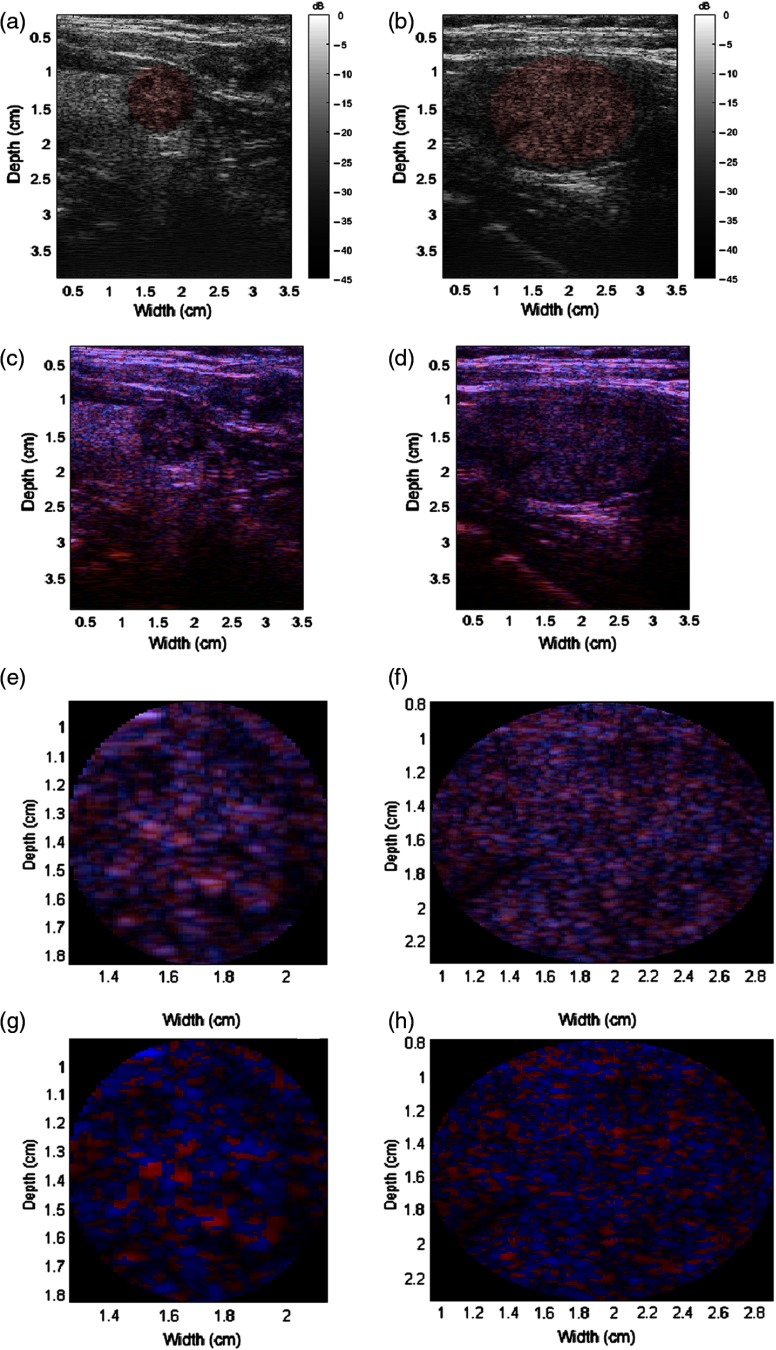
Fig. 4.
Benign nodule examples. (a and b) B-scans with the RoIs highlighted red, (c and d) H-scans, (e and f) zoomed-in H-scans of the RoIs, and (g and h) modified H-scans of the RoIs. Color bars not shown for H-scans due to triple channels; each RGB channel is displayed according to a 45-dB dynamic range.

