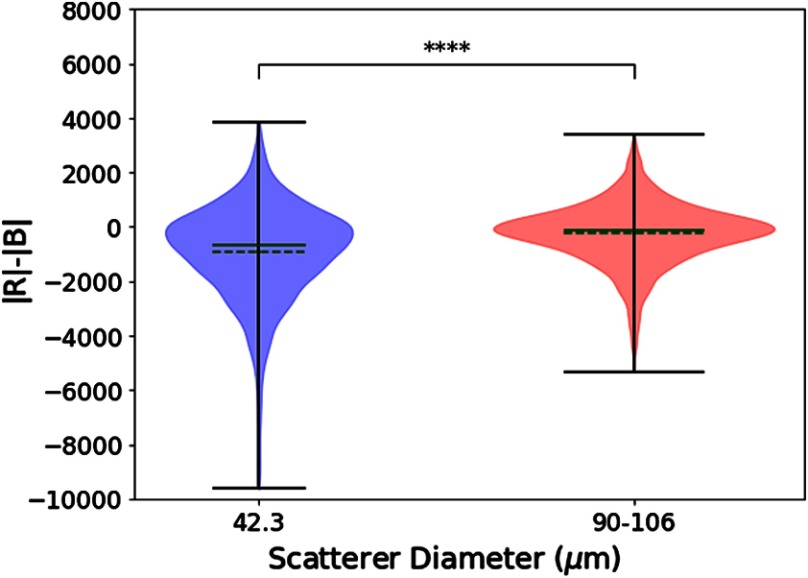
Fig. 7.
Group statistics of the pixel-by-pixel measure of the magnitude of the red channel minus the magnitude of the blue channel (a test of the relative output of matched filters influenced by scatterer size) for two phantoms, displayed as violin plots. Solid green line = median. Dashed green line = mean. A Welch’s unequal variances -test indicates that the means are not equal () and a Kolmogorov–Smirnov test indicates that the two groups come from different continuous distributions ().

