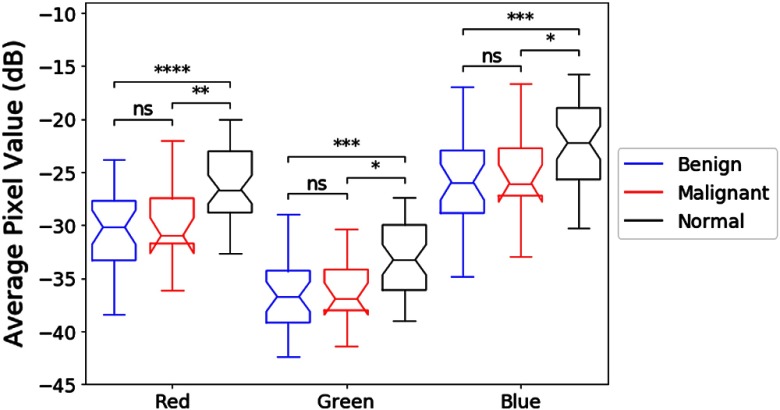
Fig. 8.
Notched boxplots of the average pixel value (in dB) of each RGB channel of benign RoIs, malignant RoIs, and normal thyroid regions. Differences in the average pixel values were observed in all three channels among the nodules and the normal thyroid regions using analysis of variance (ANOVA) (all channels ). Bonferroni corrected pairwise -tests were applied as follow-up multiple comparisons.

