Figure 1.

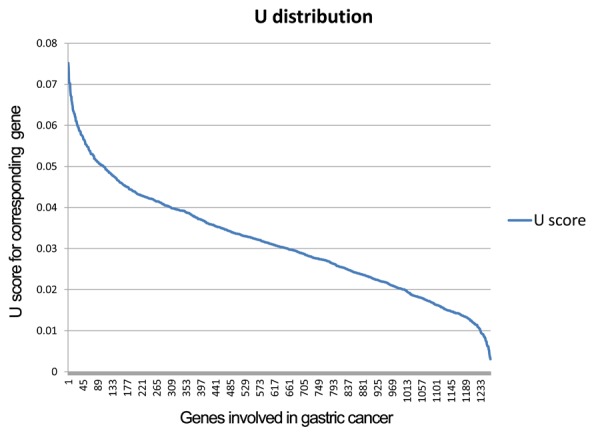
U distribution of gastric cancer-related genes. The horizontal axis represents the gastric cancer related genes, and the vertical axis shows the U value of the corresponding gene. Thu blue curve is the U distribution of all the genes.

U distribution of gastric cancer-related genes. The horizontal axis represents the gastric cancer related genes, and the vertical axis shows the U value of the corresponding gene. Thu blue curve is the U distribution of all the genes.