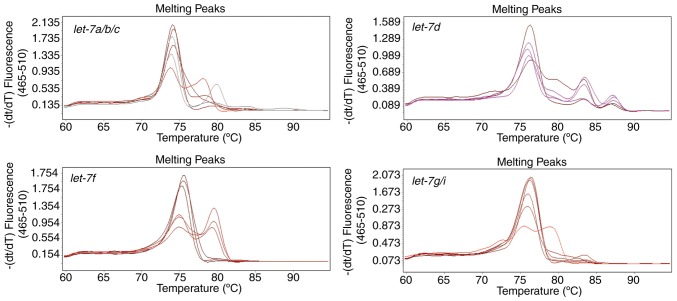
Figure 4.
Melting curves were obtained from quantitative polymerase chain reaction amplification products of representative let-7 family members using the poly(A) tailing method. For each plot, six curves were produced that represent the quantitative polymerase chain reactions that was performed twice at different concentrations of template (a high concentration and a low concentration), and each reaction using a specific concentration of template was repeated in triplicate.

