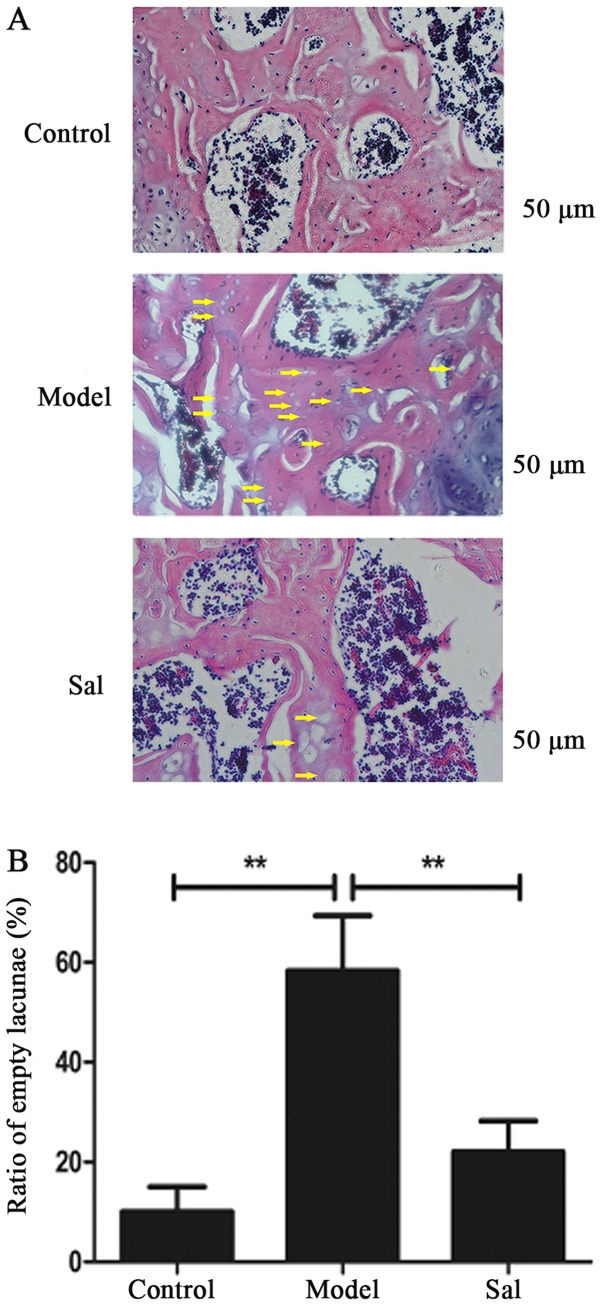
Figure 5.
Histological analysis of rat femoral heads. The model group showed numerous empty lacunae surrounded by necrotic marrow cells (A). Fewer empty bone lacunae were observed in the Sal group compared to the model group. Empty lacunae are indicated by yellow arrows (B). The ratio of empty lacunae was significantly higher in the model group compared with the control and Sal groups. Data represent the average ± standard deviation. Significant differences between two groups are indicated as **P<0.01. Sal, salidroside.

