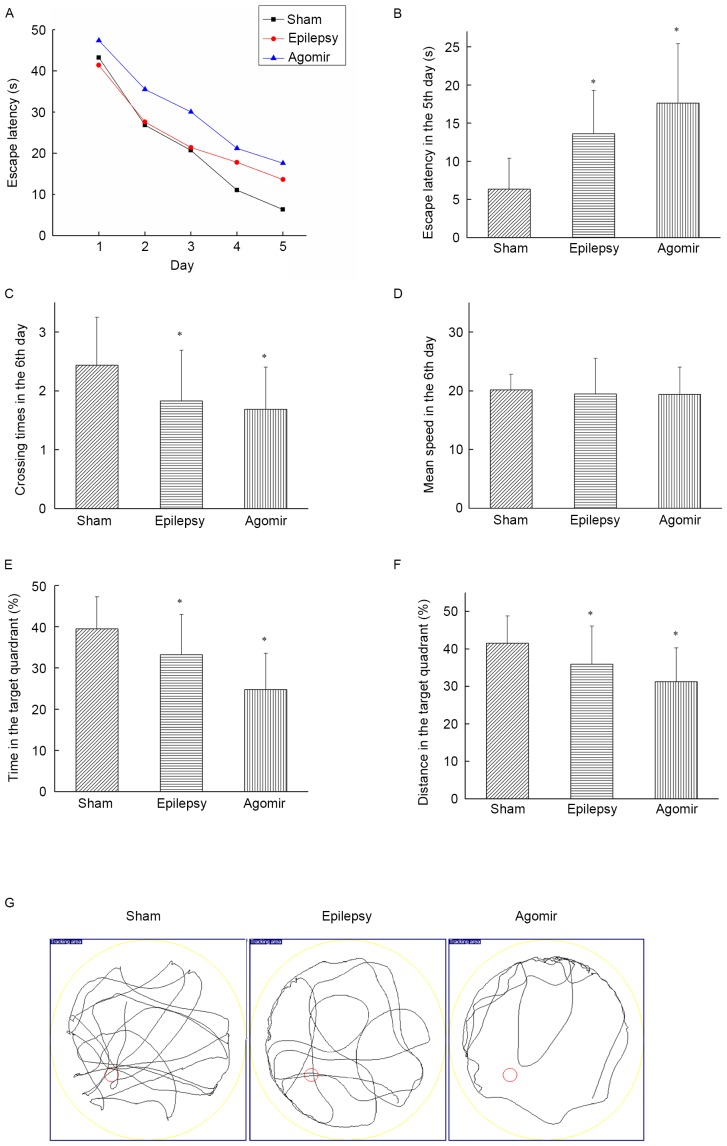
Figure 1.
Results of the Morris water maze test. (A) The trend of escape latency during 5 days. (B) The escape latency of each group on the 5th day. (C) Crossing times of each group on the 6th day. (D) The mean speed of each group on the 6th day. (E) The percentage of time that rats stayed in target quadrant. (F) The percentage of distance that rats stayed in target quadrant. (G) Track plot from the 6th day. Data are presented as the mean ± standard deviation. *P<0.05 vs. sham group.

