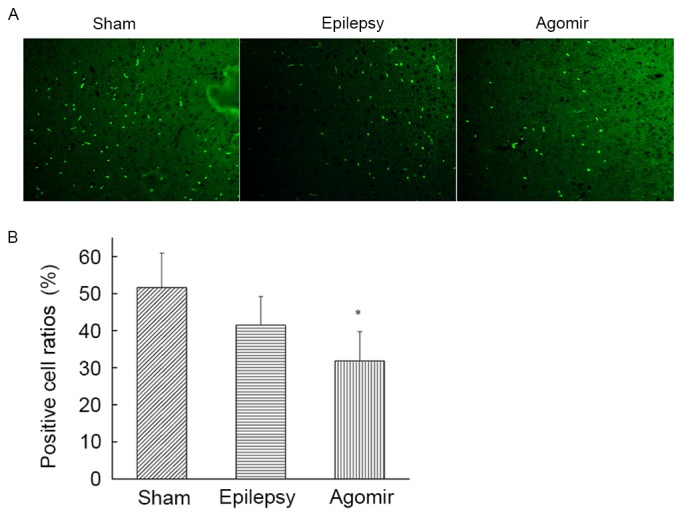
Figure 4.

Detection of NR2B protein in the cortex by immunofluorescence. (A) Representative samples (magnification, ×200) from each group (n=6). Green staining indicates NR2B expression in the cells. (B) Ratio of NR2B-positive cells in each group. Data are presented as the mean ± standard deviation. *P<0.05 vs. sham group. NR2B, Glutamate receptor ionotropic, N-methyl-D-aspartate 2B.
