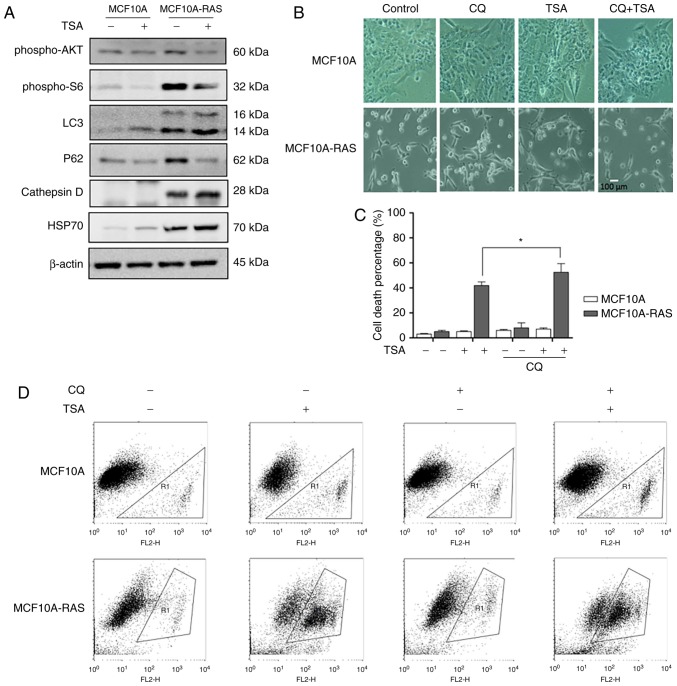
Figure 3.
TSA treatment induces autophagy via blocking mTOR pathway. (A) MCF10A and MCF10A-ras cells were treated with 0.5 µM TSA for 12 h. The cells were harvested and subjected to western blotting analysis for phospho-AKT, phospho-S6, LC3, P62, Cathepsin D and HSP70 levels. β-actin was used as a loading control. (B) MCF10A and MCF10A-ras cells were treated with 0.5 µM TSA for 12 h with or without chloroquine (25 µM) for 24 h. The cells morphology was examined under phage-contrast microscopy. Scale bar 100 µm. (C) MCF10A and MCF10A-ras cells were treated with 0.5 µM TSA, with or without chloroquine (25 µM) for 24 h. The cell viability was measured using PI live cell uptake assay coupled with flow cytometry. Data are illustrated as the mean ± SD (*P<0.05). (D) Flow cytometry of MCF10A and MCF10A-ras cells were treated with 0.5 µM TSA, with or without chloroquine (25 µM) for 24 h. TSA, trichostatin A; mTOR, mammailian target of rapamycin.

