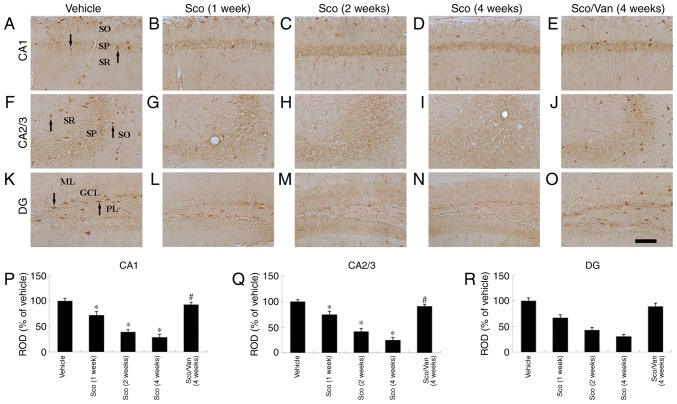
Figure 3.
ID1 immunohistochemistry in the CA1, CA2/3 and dentate gyrus (DG) regions of the vehicle-treated (A, F, K), scopolamine-treated (B-D, G-I, L-N), and scopolamine/vanillin-treated mice (E, J, O). ID1-immunoreactive cells (arrows) in the vehicle-treated mice were observed in CA1-3 and the dentate gyrus. In the scopolamine-treated mice, ID1-immunoreactive cells were markedly decreased from 1 week post-treatment with scopolamine. In the cotreated mice, ID1-immunoreactive cells were markedly increased compared with the vehicle-treated mice. Scale bar, 100 µm. (P, Q and R) ROD as percentage values of ID1 immunoreactivity in the mouse hippocampus. n=7 mice/group. *P<0.05 vs. vehicle; #P<0.05 vs. Sco at 4 weeks. Error bars indicate the mean ± standard error of the mean. GCL, granule cell layer; ML, molecular layer; PL, polymorphic layer; SO, stratum oriens; SP, stratum pyramidale; SR, stratum radiatum; Sco, scopolamine-treated; Sco/Van, scopolamine/vanillin-cotreated; ID1, DNA binding protein inhibitor ID-1; ROD, relative optical density.

