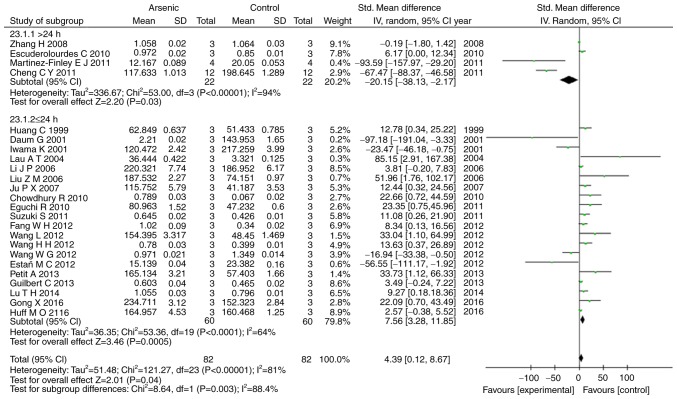
Figure 7.
Subgroup analyses to determine the effects of arsenic on p-ERK2 based on exposure time. Forest plot showing the impact of arsenic treatment on p-ERK2 compared to controls. Total column represents total number of studies performed. SMD, standardized mean difference; IV, independent variable; 95% CI, 95% confidence interval; SD, standard deviation.

