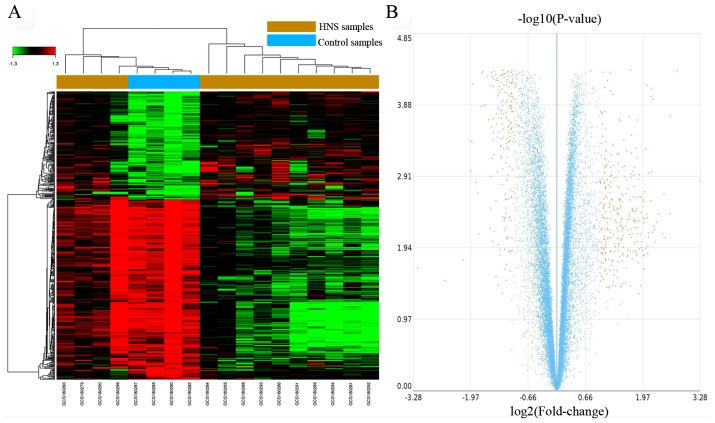
Figure 1.
DEGs between HNS and control samples. (A) Heat map of the DEGs, red indicates upregulated genes and green indicates downregulated genes. (B) Volcano plot of the DEGs (Yellow indicates DEGs with |log2 fold-change|>1 and false discovery rate <0.05. Blue indicates non-DEGs). HNS, hypertensive nephrosclerosis; DEG, differentially expressed genes.

