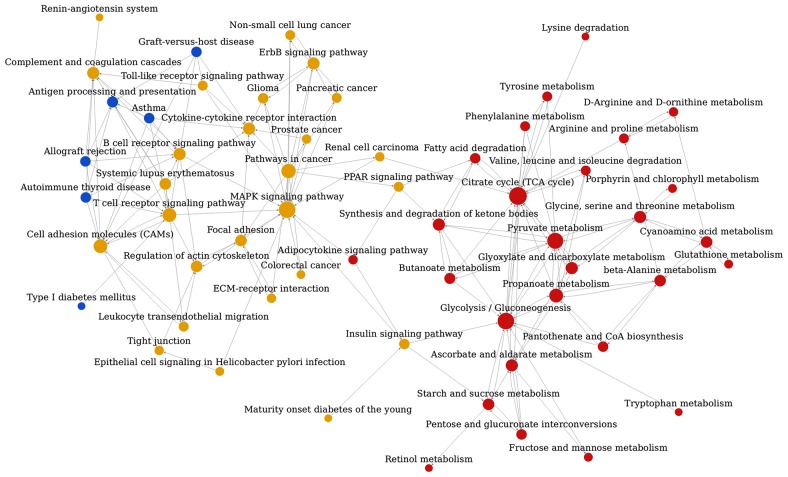
Figure 3.
Relationship network of significant pathways associated with hypertensive nephrosclerosis. Nodes represent pathways. The size of the nodes represents the associated degree value. Lines with arrows represent interactions between pathways, whereas the pathways with arrow tails regulate pathways with the associated arrow's head. Red nodes represent upregulated pathways, blue nodes represent downregulated pathways, and yellow nodes indicate that there were genes associated with the pathway that were both up and downregulated. PPAR, peroxisome proliferator-activated receptor; MAPK, mitogen-activated protein kinase; ECM, extracellular matrix.

