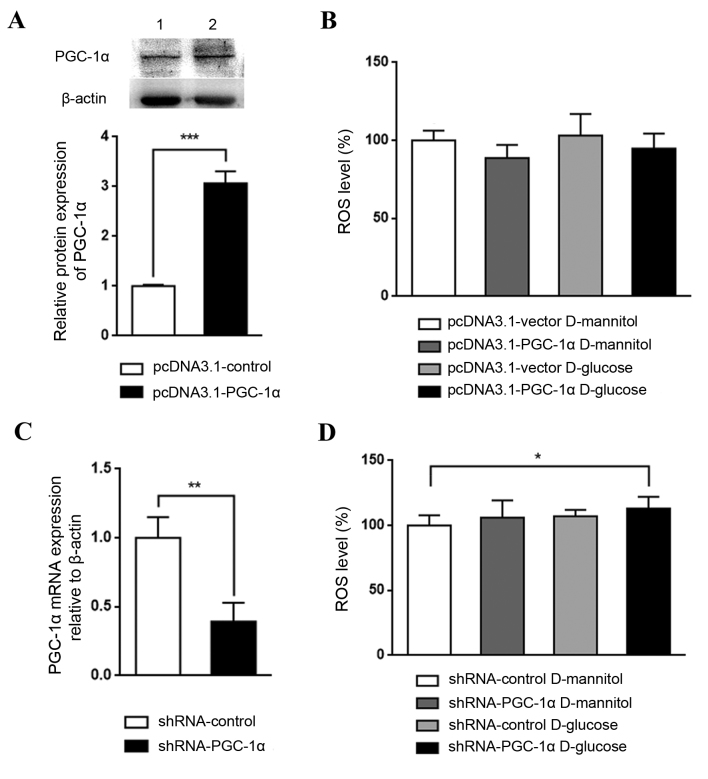
Figure 4.
Effect of PGC-1α knockdown or overexpression on high glucose-induced ROS generation in mesangial cells. (A) Confirmation of PGC-1α expression in SV40 MES 13 cells transfected with pcDNA3.1-vector (lane 1) or pcDNA3.1-PGC-1α (lane 2) by western blotting and the corresponding relative quantification of average band intensity. Data are presented as the mean ± standard deviation (n=3). (B) Intracellular ROS levels were detected in SV40 MES 13 cells following high glucose treatment in the PGC-1α overexpression or control vector transfection groups using a fluorescence microplate reader. Data are presented as a percentage of the control group (pcDNA3.1-vector D-mannitol). The experiment was repeated three times (n=6 per group). (C) Confirmation of PGC-1α mRNA expression by reverse transcription-quantitative polymerase chain reaction in SV40 MES 13 cells transduced with shRNA-control or shRNA-PGC-1α (n=3). (D) ROS levels in SV40 MES 13 cells transduced with control or PGC-1α shRNA and treated with D-glucose or D-mannitol were measured and presented as a percentage of the control group (shRNA-control D-mannitol) Three independent protein preparations were each run in 6 samples. All data are presented as the mean ± standard deviation. *P<0.05, **P<0.01 and ***P<0.001, as indicated. PGC-1α, peroxisome proliferator-activated receptor γ coactivator-1α; ROS, reactive oxygen species; shRNA, short hairpin RNA.

