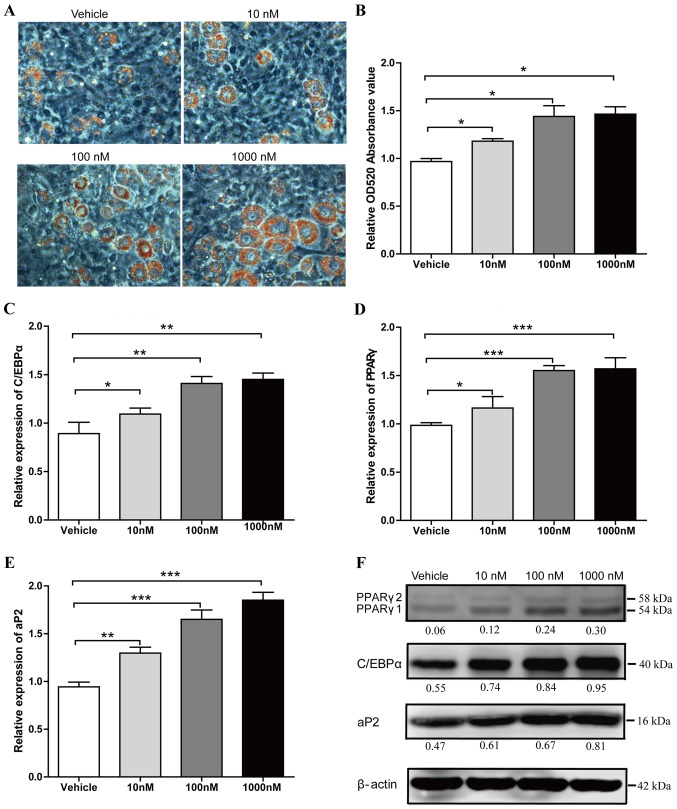
Figure 1.
Liraglutide promotes adipogenic differentiation of 3T3-L1 cells. Preadipocyte 3T3-L1 cells were cultured in adipocyte-inducing medium and treated with different concentrations of liraglutide. (A) Representative images of differentiated and treated cells were labeled with Oil Red O at day 5. (B) Oil Red O extracted with isopropanol was measured at OD520, the values represent the mean ± standard deviation. The mRNA expression levels of key transcription factors, (C) C/EBPα and (D) PPARγ, as well as (E) the adipocyte-specific gene aP2, were analyzed by reverse transcription-quantitative polymerase chain reaction at day 2. Results represent the mean ± standard deviation. (F) The protein expression levels of C/EBPα, PPARγ and aP2 were assessed by western blot analysis at day 3 of differentiation. The value under each lane indicates the relative expression level of the genes, which is represented by the intensity ratio between PPARγ, C/EBPα or aP2 and β-actin bands in each lane. β-actin was used as an internal control. Image magnification, ×200, and all data represent three separate experiments. One-way analysis of variance was used followed by Tukey's post hoc test to analyze the differences between the other groups with the vehicle group in B-E. *P<0.05, **P<0.01 and ***P<0.001 vs. vehicle group. OD, optical density; C/EBPα, CCAAT/enhancer binding protein α; PPARγ, peroxisome proliferator-activated receptor γ; ap2, adipocyte protein 2.

