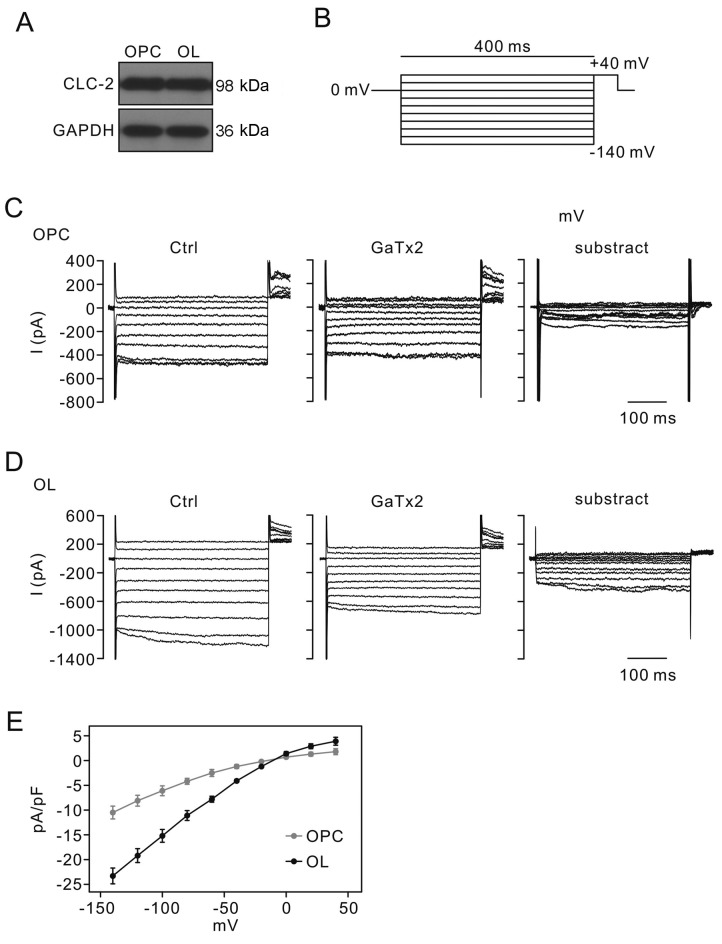
Figure 2.
Effect of GaTx2 on CLC-2 current (ICLC-2) in OPCs and OLs. (A) CLC-2 protein expression levels in OPCs and OLs. GAPDH served as the internal control. Bands were analyzed with ImageJ version 1.49v software (National Institutes of Health, Bethesda, MD, USA). The densities of the bands were: CLC2 in OPC (779.07±21), OL (772.44±19), GAPDH in OPC (628.09±12) and OL (631.48±9). (B) Schematic diagram of voltage stimulation mode. (C) OPCs and (D) OLs were stimulated with voltages between −140 and +60 mV in the three groups. ICLC-2 (right panel) was calculated by subtracting GaTx2 (10 nM)-sensitive currents (middle panel) from the control current (left panel). (E) Current to voltage association curves of ICLC-2 in OPCs and OLs. OPCs, oligodendrocyte precursor cells; OLs, oligodendrocytes; CLC-2, voltage-gated chloride channel 2.

