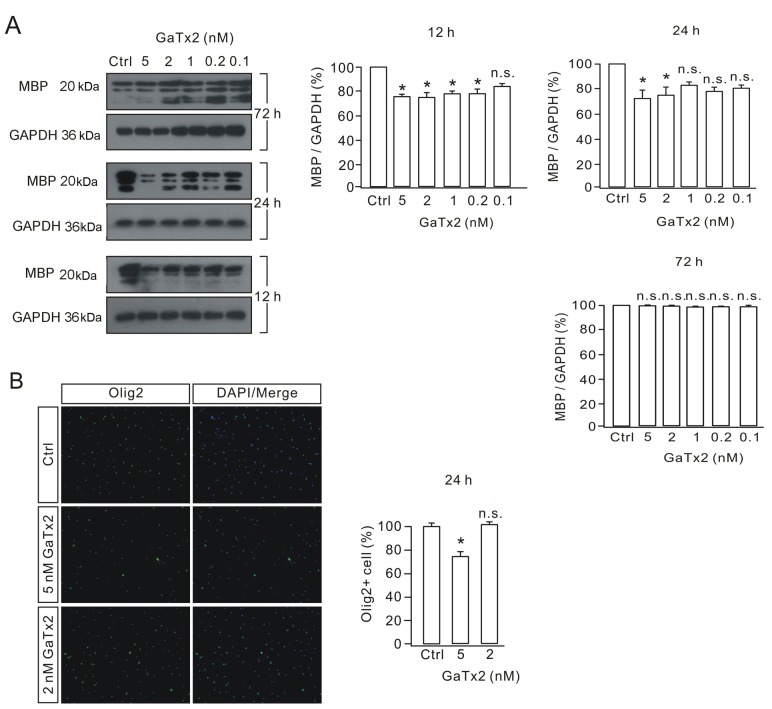
Figure 3.
Effective concentration of GaTx2 in the inhibition of OL activity. (A) OL cultures were treated with different concentrations of GaTx2 for different durations. MBP expression levels were measured by western blotting and densitometric analysis was performed to quantify protein levels. (B) Olig2 immunostaining following 2 or 5 nM GaTx2 treatment for 24 h, indicating the difference compared with the control group. The experiment was repeated four times. Scale bar, 40 µm. *P<0.05 vs. Ctrl. OLs, oligodendrocytes; MBP, myelin basic protein; Olig2, oligodendrocyte transcription factor 2; Ctrl, control; n.s., not significant.

