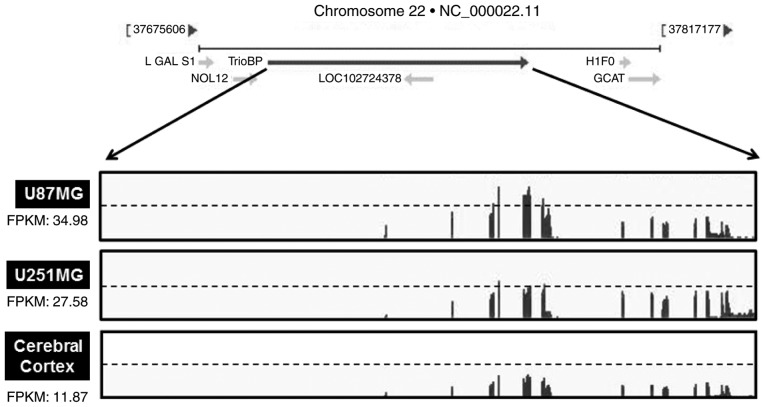
Figure 3.
Relative changes of TrioBP transcripts from GBM cells in standard RNA-seq data. Total RNA were isolated from two GBM cell lines (U87-MG and U251-MG) and normal brain tissue. These samples were further analyzed by the standard RNA deep sequencing (RNA-seq) as described in the material and methods. RNA-seq read density for TrioBP transcripts was plotted with the relative RNA-seq read coverage (counts). Fragments per kilobase of exon per million fragments mapped (FPKM) were calculated to compare the expression level of TrioBP mRNA variants in each sample.

