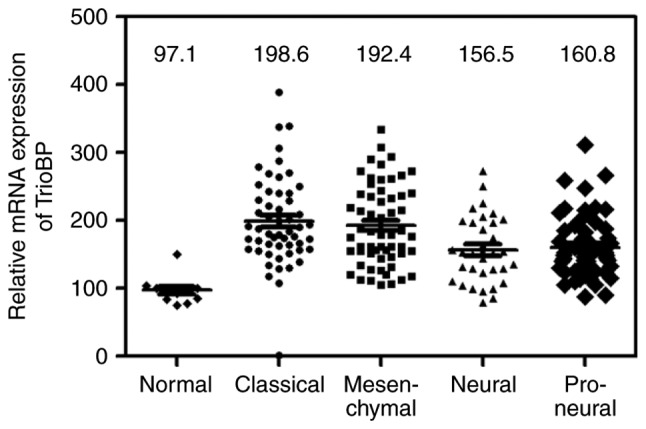
Figure 6.

Bioinformatical analysis of glioma specimens for TrioBP mRNA expression from the TCGA GBM cohort The expression levels of TrioBP mRNA were detected in various glioblastoma (Normal; n=11, Classical; n=54, Mesenchymal; n=58, Neural; n=33, Proneural; n=57). The median value of each group is indicated as a line.
