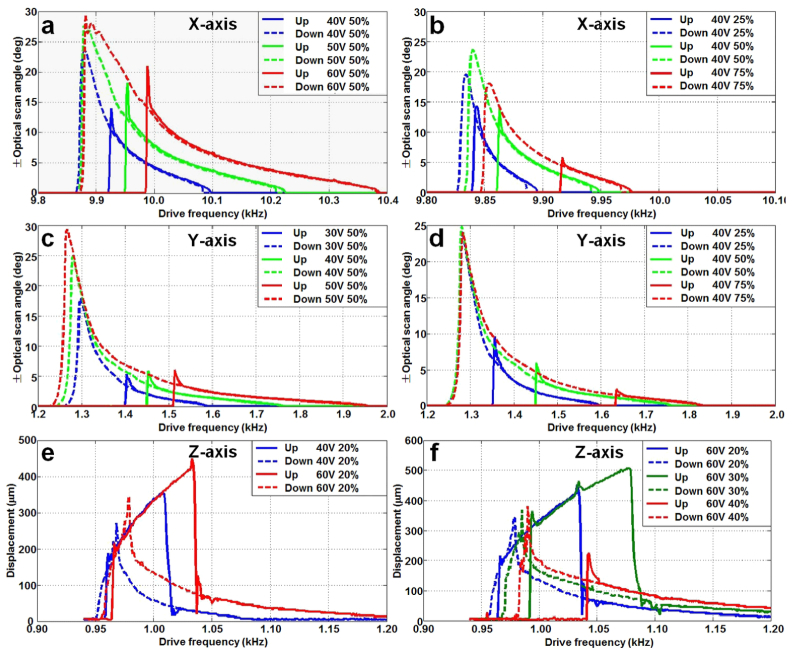
Fig. 5.
Frequency response of monolithic 3D scanner. The optical scan angle in the X-axis is shown with a) drive voltages between 40 and 60Vpp and 50% duty cycle and b) at 40Vpp with 25-75% duty cycle with either an upsweep (low-to-high) or downsweep (high-to-low) of frequency. Results in the Y-axis is shown with c) drive voltages between 30 and 50Vpp and 50% duty cycle and d) at 40Vpp with 25-75% duty cycle. Out-of-plane displacement in the Z-axis is shown with e) drive voltages between 40 and 60Vpp and 20% duty cycle and f) at 60Vpp with 20-40% duty cycle.

