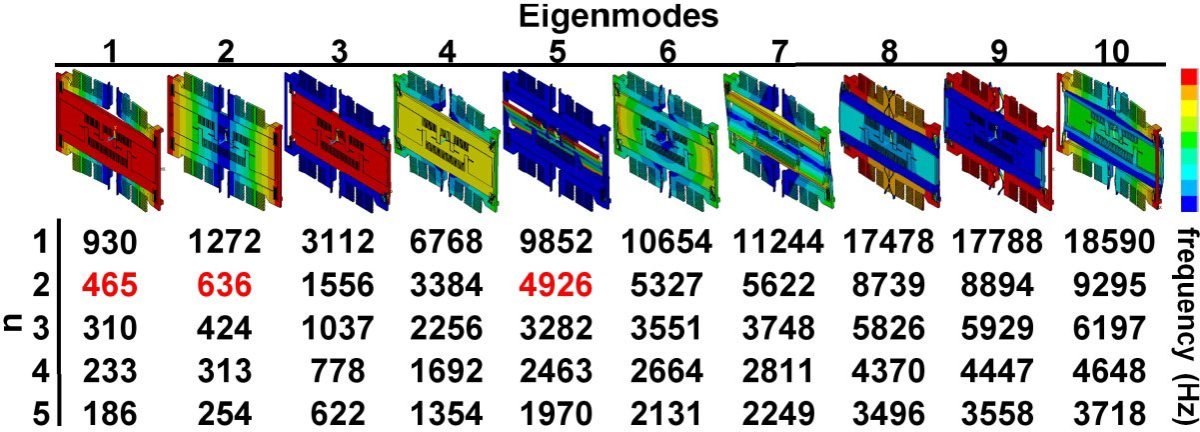
Table 1. Modal analysis for 3D scanner. FEM analysis for the optimized scanner design shows results for first ten eigenmodes. The eigenmodes for n = 2 represent the first set of excitation frequencies used with parametric resonance. Model provides approximate values for exciting the Z (465 Hz), Y (636 Hz), and X (4926 Hz) axes (shown in red). Color legend shows relative displacement.

