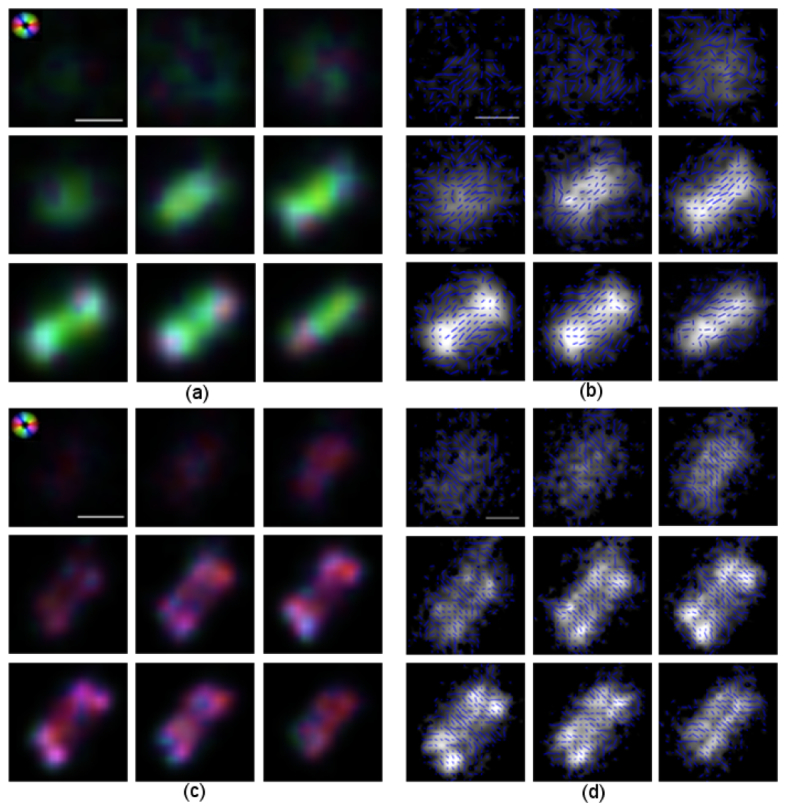
Fig. 5.

Polarization analysis of yeast cells reveals protein organization. We here show zoomed-in views of the cells (i) and (ii) indicated by white rectangles in Fig. 4. All nine focal planes of each MFM image are shown. (a) Protein orientation in cell (i) indicated by color, according to the aster in the upper left corner. (b) Protein orientation in cell (i) indicated by lines. In this cell, the septin complex is in the single hourglass conformation with protein organized orthogonally to the mother-bud axis. (c) Protein orientation in cell (ii) indicated by color according to the aster in the upper left corner. (d) Protein orientation of cell (ii) indicated by lines. In this cell, the hourglass structure has split into two rings preparing for cell division. The protein has undergone a 90-degree orientation change and is aligned along the mother-bud axis. The data has been resampled and contrast adjusted for display. Scale bar 1μm.
