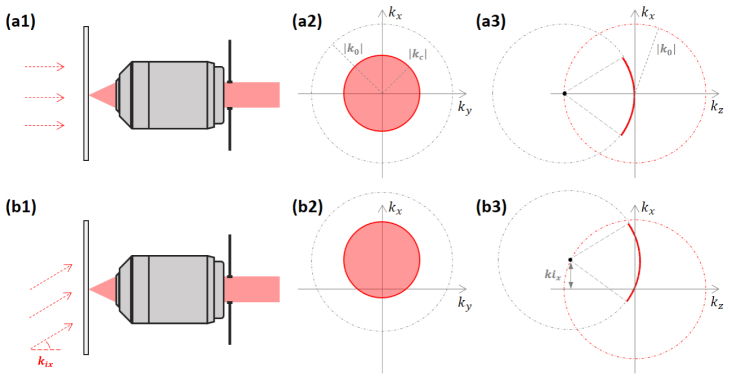
Fig. 6.
Three dimensional spatial frequency space analysis of Fourier ptychography. (a1-a3) Normal angle illumination case, (b1-b3) oblique angle illumination case. Solid line red circles and arcs represents spatial frequency information of the sample captured with the microscope system under certain illumination, and dot rings depict the cross-sections of Ewald spheres.

