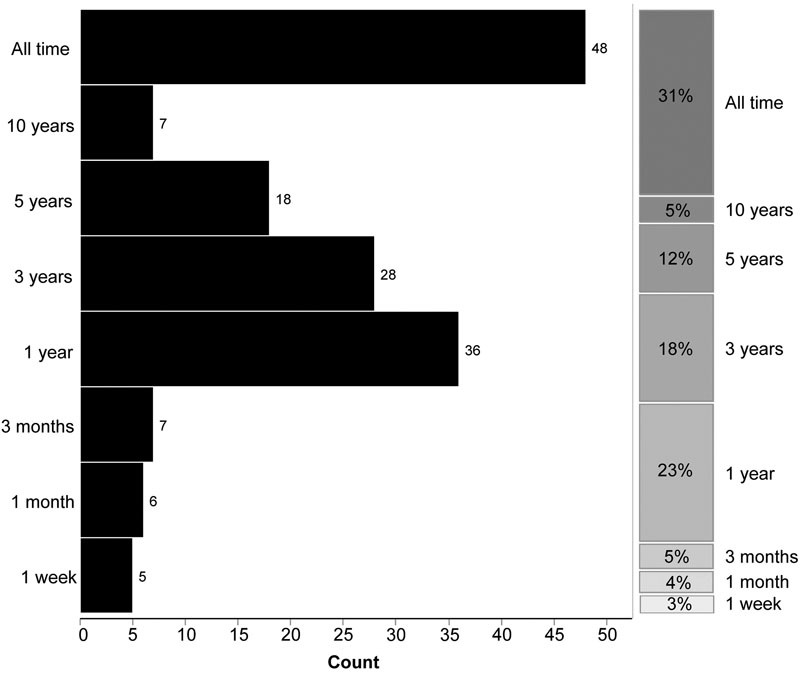
Fig. 2.

Self-reported historical depth of electronic chart review for new medical ICU patients (n = 155). “On average, how far back into the record do you review during a typical chart review?” (Y-axis). Histogram bars and counts appear on the left side of the figure, with the right stacked column indicating relative percentages. ICU, intensive care unit.
