
Fig. 2.
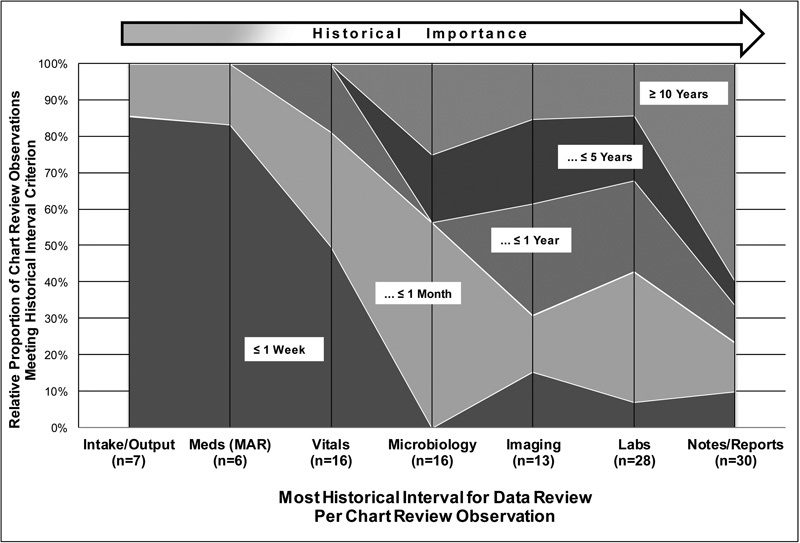
The most historical interval over which data were searched or viewed (in relation to the admission date) were recorded and categorized in intervals from ≤ 1 week to ≥ 10 years. Area plots define the relative proportion of chart review observations within each historical time interval (overlaid labels), grouped by data category and sorted in order of increasing likelihood to review older, more historical data. “ n ” per category = number of observations for which the data category was captured for historical analysis. “MAR” = medication administration record. “Notes/Reports” = clinical notes and diagnostic reports.