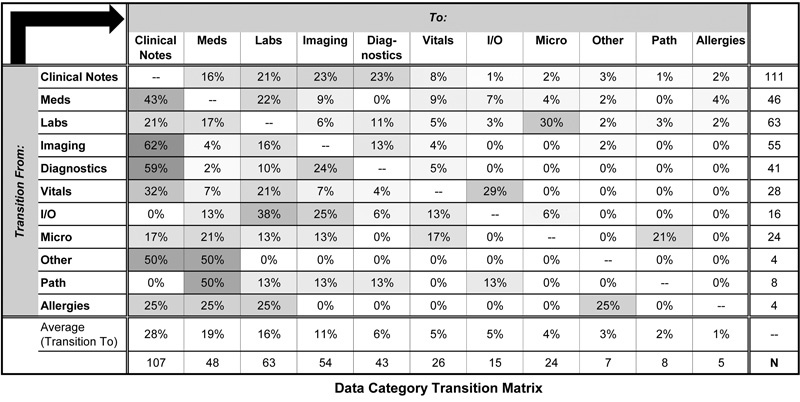
Fig. 3.

Heatmap figure showing the probability of transitioning from viewing one data category (rows) to the next (columns), as a continuous gradation from the lowest value (0%, white) to the highest (62%, gray). Cell values represent percentages within each row. “Meds” = active outpatient and inpatient medication lists, and inpatient medical administration record (MAR). “Diagnostics” = nonlaboratory, nonimaging diagnostic study that generates a text report. “I/O” = intake/output data. “Micro” = microbiology data. “Path” = pathology data. “Other” = clinical data not otherwise categorized, such as flowsheet records, appointment schedule, administrative demographic data, advanced directives, and active inpatient orders. “Allergies” = allergy and immunization list.
