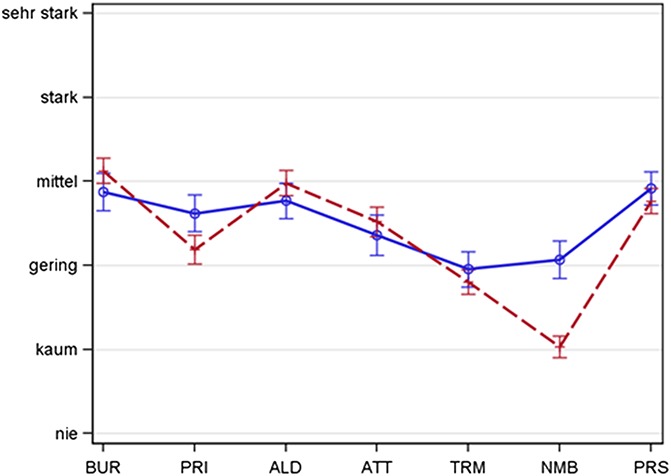
Figure 2.

Spaghetti plot representing the distribution of somatosensory symptoms—face vs thoracic (not adjusted). Intensity of sensory symptoms captured with the painDETECT questionnaire in trigeminal postherpetic neuralgia (blue, solid line, n = 277) and in thoracolumbar postherpetic neuralgia (red, broken line, n = 517). Mean + 95% CI. The symptom intensity is represented by the patterns of questionnaire scores (not adjusted individual mean), thus showing the typical pathological structure of the respecting group. Sensory profiles show differences in the expression of the symptoms. Significant differences were shown for prickling and numbness. Patients could graduate different sensory symptoms and rate the perceived severity of each symptom from 0 to 5 (never = nie, hardly noticed = kaum, slightly = gering, moderately = mittel, strongly = stark, and very strongly = sehr stark). ALD, allodynia; ATT, attacks; BUR, burning; CI, confidence interval; NMB, numbness; PRI, prickling; PRS, pressure; TRM, thermal.
