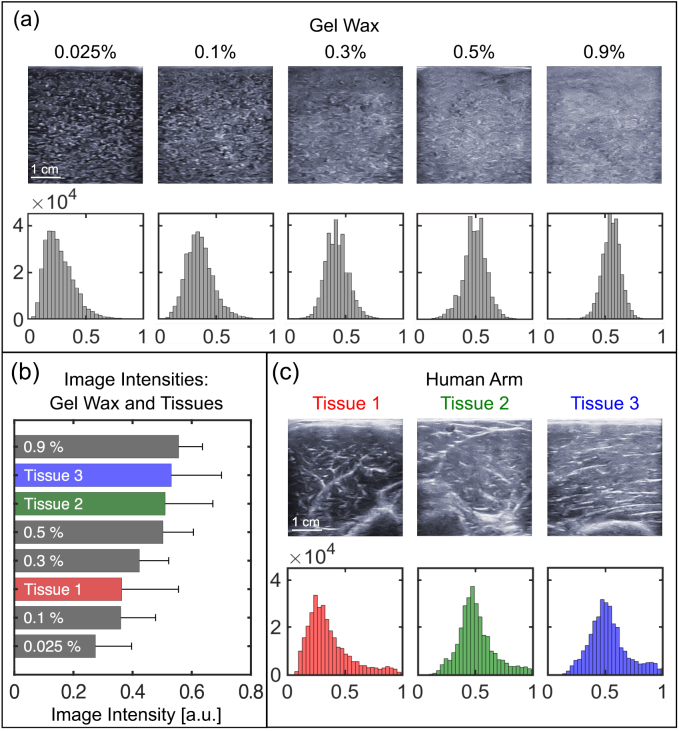
Figure 2.
Acoustic backscattering of gel wax samples in comparison with tissues. (a) Ultrasound images and histograms of gel wax samples comprising 2 w/w% paraffin wax and different glass sphere concentrations. (b) Comparison of mean image intensity values of ultrasound images from gel wax samples and tissues. The error bars represent standard deviations. (c) Ultrasound images and histograms of human arm tissues. The ultrasound acquisition settings in (a) and (c) were consistent; only the speed of sound used for reconstruction was different (gel wax: 1440 m s−1, human tissues: 1540 m s−1).

