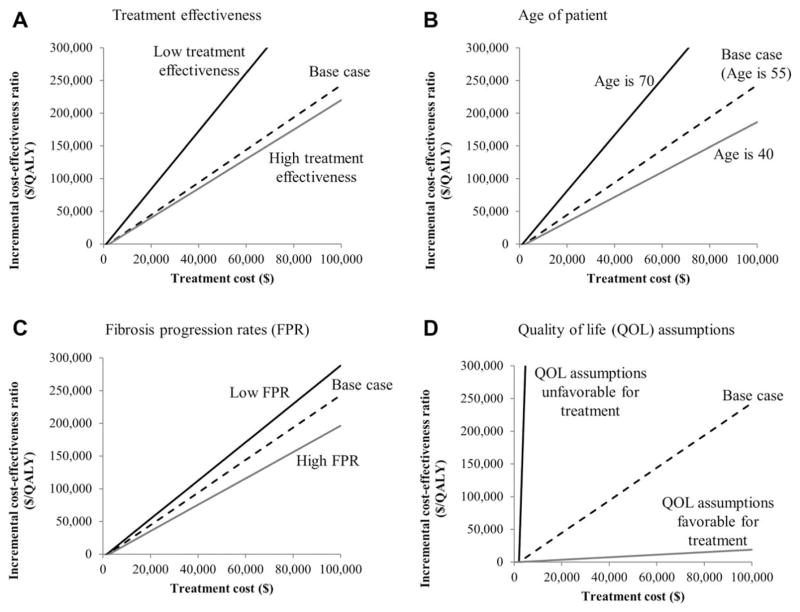
Fig. 2.
Threshold analyses on treatment cost for HCV-infected patients with no fibrosis where each panel demonstrates the range of parameter values for (A) treatment effectiveness, (B) age of patient, (C) fibrosis progression rates, and (D) quality-of-life assumptions. The lines represent the incremental cost-effectiveness ratios for the treatment of hepatitis C–infected patients at liver disease stage F0 under various assumptions about parameter values. Treatment at F0 is compared to treatment F2 because treatment at F1 is dominated by treatment at F0 for the following scenarios: base case, high treatment effectiveness, age is 70, low fibrosis progression rate, quality-of-life assumptions favorable for treatment. Abbreviations: FPR, fibrosis progression rate; QOL, quality of life.

