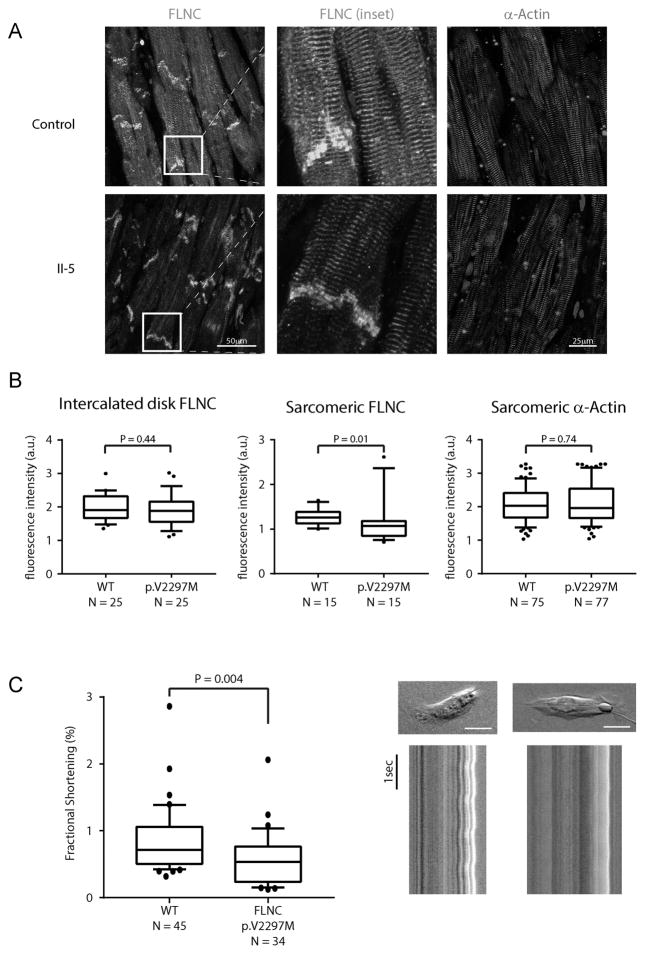
Figure 3. Cellular consequences of FLNC p.V2297M variant.
A: Localization of FLNC (green) and α-MHC (red) in ventricular free wall tissue obtained from a control sample and in the failing heart of II-5. Images were obtained from independent tissue sections B: Quantification of fluorescence intensity for intercalated disk resident FLNC, sarcomeric FLNC, and sarcomeric α-actin. Images from all samples were obtained with equivalent acquisition conditions. N represents number of independent intercalated disks or myofibrils examined. C: Left panel: Comparison of fractional shortening measured from singularized stem cell derived cardiomyocytes. N represents the combined number of cells analyzed in three independent experiments. Error bars represent the SEM. Right panel: Representative images of isolated cardiomyocytes. Red line represents the major axis for fractional shortening measurement. Scale bar represents 20μm. Lower images represent line scans of the major axes for wild-type and mutant cardiomyocytes displayed over time.

