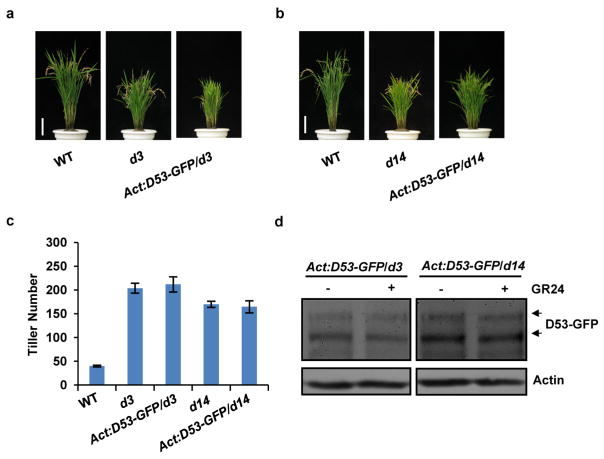
Extended Data Figure 8. Phenotypes of transgenic plants of constitutively expressed D53–GFP in d3 and d14.
a, Phenotypes of wild-type, d3 and Act:D53-GFP/d3 transgenic plants at the mature stage. Scale bar, 10 cm. Six independent transgenic lines showed similar phenotypes. b, Phenotypes of wild-type, d14 and Act:D53-GFP/d14 transgenic plants at the mature stage. Scale bar, 10 cm. Six independent transgenic plants showed similar phenotypes. c, Tiller numbers of Act: D53-GFP/d14 and Act:D53-GFP/d3 transgenic plants at the mature stage. Values are means ±s.d. (n =8). d, The D53–GFP abundance in d3 or d14 plants treated with 10 μM GR24 for 60 min. Protein levels were analysed by immunoblotting using GFP antibody. Rice plants (T1 generation) were grown in the field in Hainan province.

