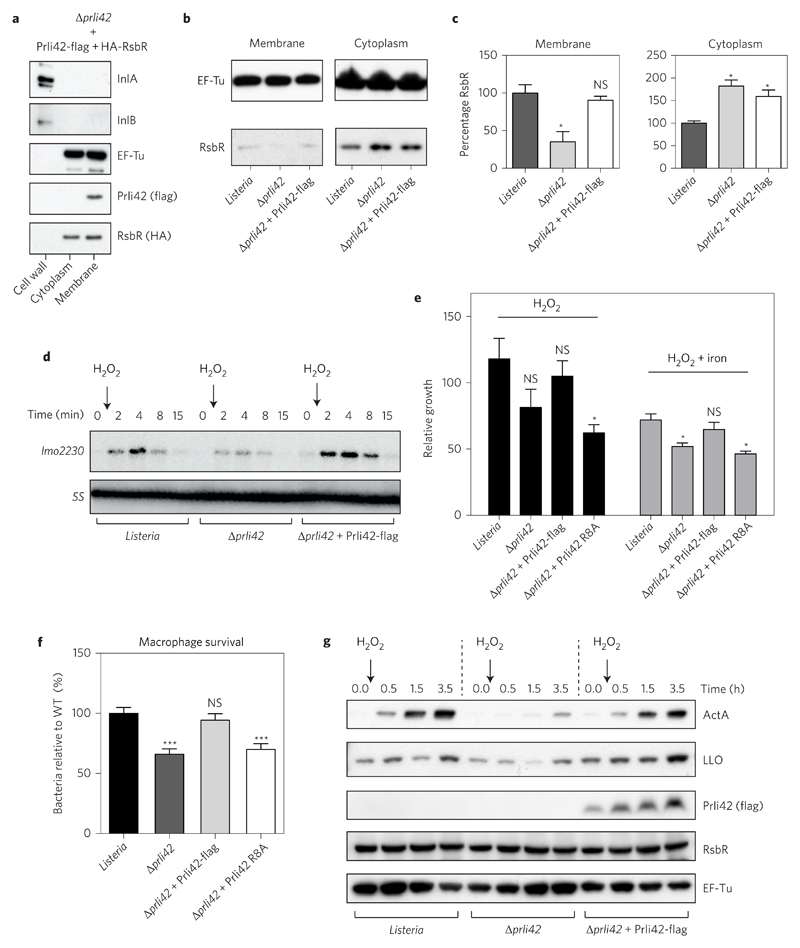
Figure 4. Membrane miniprotein Prli42 partially tethers RsbR to the bacterial membrane and is essential for the sigma B signalling following oxidative stress and survival in macrophages.
a, Prli42-flag and HA-RsbR were expressed in Δprli42 bacteria. Cellular fractions were analysed by immunoblot. InlA, InlB and EF-Tu were used as controls for fractionation. b, Localization of endogenous RsbR was analysed by immunoblot after cellular fractionation. EF-Tu was used as a loading control. c, Quantification of RsbR levels in membrane or cytosolic fractions relative to EF-Tu and normalized to levels in WT bacteria using ImageJ. Values are expressed as mean ± s.e.m. of three independent experiments. d, 0.05% H2O2 was added to exponential cultures and sigma B pathway activation was assessed by northern blot using the lmo2230 gene and 5S as a loading control. e, Bacteria were grown in BHI medium and 0.05% H2O2 ± iron (2.5 μg ml–1 FeC6H5O7) was added to cultures in exponential growth. The number of living bacteria was monitored by counting c.f.u. For each time point and for each strain, the number of c.f.u. is shown relative to the number of c.f.u. at time zero. Results are expressed as mean ± s.e.m. of four independent experiments. f, BMDMs were infected and cells were lysed at 24 h post-infection, and the released bacteria were counted. WT c.f.u. average was normalized to 100 to cross-compare experiments between macrophages from different mice. Results are expressed as mean ± s.e.m. of five independent experiments. g, Expression of ActA and listeriolysin O (LLO) following H2O2 treatment (as in d) was analysed by immunoblot and is representative of three experiments. Lysates were from total bacterial pellet. Flag, RsbR and EF-Tu were used as controls. Immunoblots and northern blot shown in a, b, d and g are representative of three independent experiments. For all graphs, significance was determined by ordinary one-way analysis of variance followed by Dunnett’s multiple comparison test, and significance is shown relative to WT in each condition (***P < 0.001; *P < 0.05; NS, not significant).

