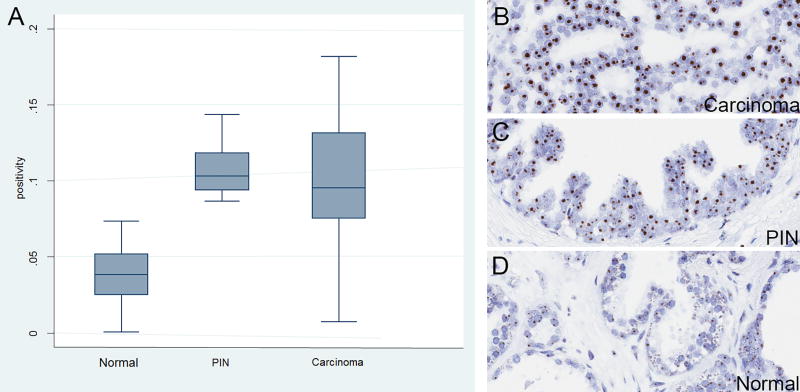
Figure 4. 5′ETS/45S CISH in human prostate whole tissue sections.
A, Left panel shows box plot results of quantification of D, normal, C, high grade PIN and B, carcinoma regions (n=30). Original magnifications, × 200. Boxes are bounded by 25th and 75th percentiles, with median shown as line. Whiskers are 2× the interquartile range and outliers are shown as individual data points. Y-axis shows the ratio of the area of positive pixels over the area of total nuclear pixels (positivity).

