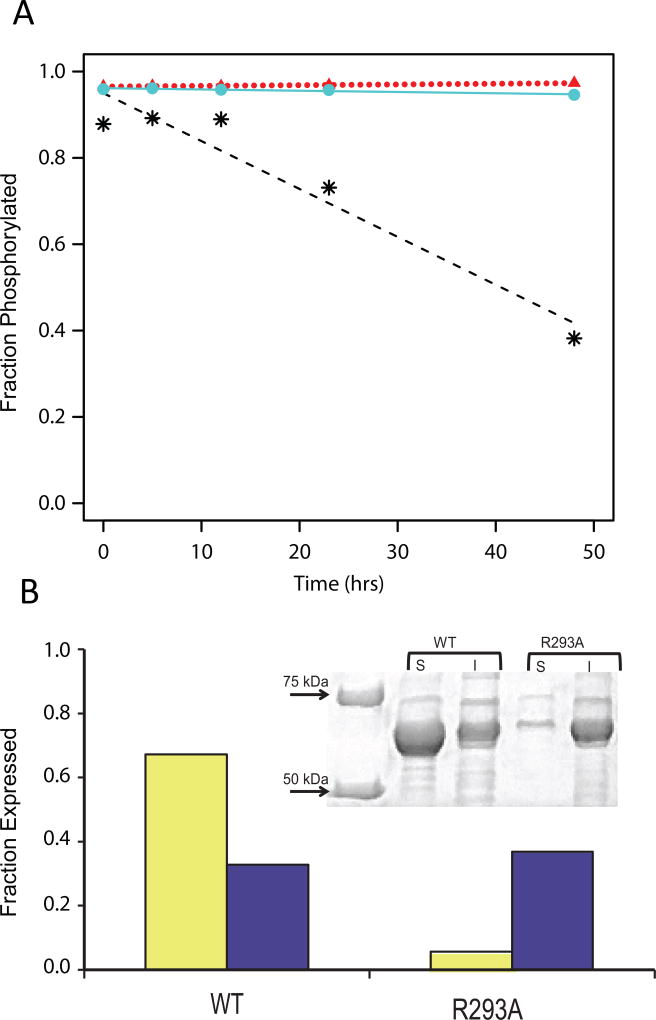
Figure 4. Biochemical data on phosphorylation and protein expression/solubility.
(A) Time course of dephosphorylation from hydrolysis for WT PGM1 (*, dashed line) and the D263Y (circles, solid line) and D263G (triangles, dotted line) missense variants as determined by ESI-MS.
(B) Reduced expression and solubility of the R293A mutant relative to WT PGM1. SDS/PAGE (top) and corresponding histogram (bottom) showing the soluble (yellow) and insoluble (purple) fractions of cell extracts from E. coli cultures of WT PGM1 and the R293A mutant. Relative protein levels on the histogram are normalized to a value of 1.0 using the combined amounts of soluble/insoluble protein obtained for WT PGM1.

