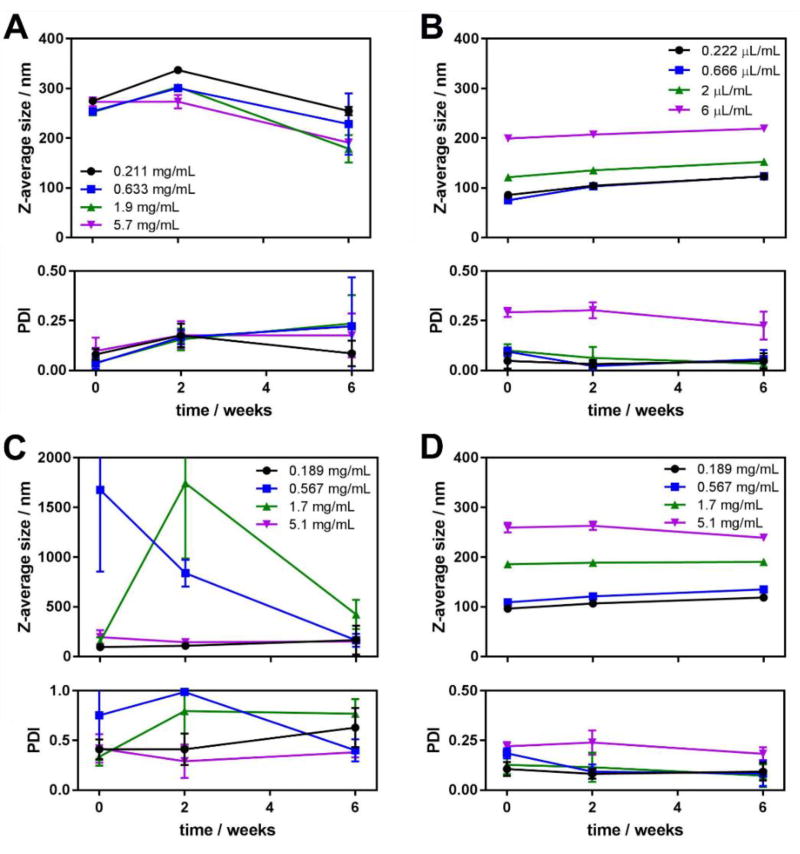
Figure 2.
Average aggregate size (top) and polydispersity index (bottom) obtained from cumulants analysis of the DLS experiment data for the aggregates of compounds II (A), III (B), IV (C) and V (D) in 0, 2 and 6 weeks after preparation. Each experimental point is an average of 5 independent measurements, and the error bars represent the standard deviation.

